Smart Money Concepts (SMC) Trading Guide: Inner Circle Trader (ICT) Strategies Explained for Beginners
A beginner-friendly guide to Smart Money Concepts and ICT strategies: liquidity sweeps, market structure shifts, order blocks, fair value gaps, and how to turn them into a repeatable process.
Key takeaways
- SMC and ICT focus on liquidity and institutional order flow rather than indicator-based signals.
- Liquidity sweeps and changes of character often occur together and form the framework's classic reversal sequence.
- Order blocks and fair value gaps are zones of interest for entries, meaningful only in combination with structure.
- A 1:2 risk-to-reward framework allows profitability without a high win rate, and position sizing follows from the stop.
- My Simple Strategy Book turns these concepts into step-by-step rules for daily practice.
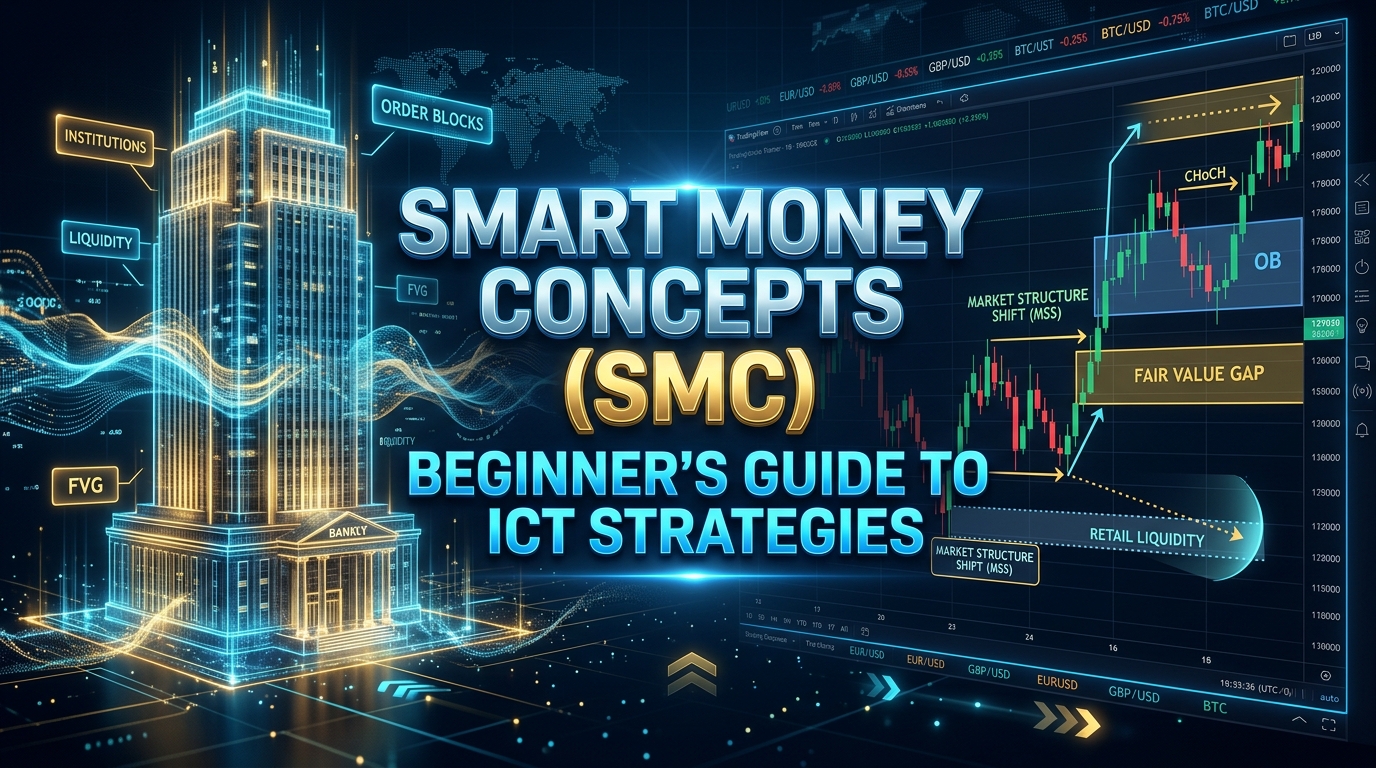
Smart Money Concepts, usually shortened to SMC, is a way of reading charts that asks a different question from most beginner courses. Instead of asking which pattern or indicator is flashing a signal, it asks where large participants, such as banks, funds and market makers, are likely to have accumulated positions, and where their unfilled interest might pull price next. The Inner Circle Trader, or ICT, is a teaching framework built around the same idea, popularised by Michael J. Huddleston. This guide explains the core pieces of that framework, including liquidity, market structure shifts, order blocks and fair value gaps, in plain language for beginners.
To understand why the framework exists, it helps to picture how institutional and retail trading differ in practice. A retail trader can open or close a position with a single click, and the market absorbs it without noticing. An institution moving hundreds of millions cannot. It needs counterparties on the other side, which means it needs liquidity: clusters of orders, stop losses and pending positions it can trade against. Institutions therefore plan entries across multiple sessions, build positions gradually, and often push price toward areas where orders are crowded before taking the opposite side. Retail traders, with small size and instant execution, do not face this problem, which is why their behaviour on the chart looks so different.
Traditional technical indicators are calculations derived from past price, such as moving averages or oscillators. They can be useful, but they describe what has already happened rather than who is positioned. A buy signal can appear at a level where large sell orders are resting, simply because the indicator has no way of seeing those orders. SMC does not replace indicators with certainty either; nothing does. What it offers is a lens: it teaches you to mark liquidity pools, watch how price behaves around them, and read the structural changes that occur when large participants stop defending one side of the market. Used with discipline, that lens can add context that a naked indicator signal lacks.
Introduction: What Are Smart Money Concepts (SMC) and ICT?
Smart Money Concepts, usually shortened to SMC, is a way of reading charts that asks a different question from most beginner courses. Instead of asking which pattern or indicator is flashing a signal, it asks where large participants, such as banks, funds and market makers, are likely to have accumulated positions, and where their unfilled interest might pull price next. The Inner Circle Trader, or ICT, is a teaching framework built around the same idea, popularised by Michael J. Huddleston. This guide explains the core pieces of that framework, including liquidity, market structure shifts, order blocks and fair value gaps, in plain language for beginners.
To understand why the framework exists, it helps to picture how institutional and retail trading differ in practice. A retail trader can open or close a position with a single click, and the market absorbs it without noticing. An institution moving hundreds of millions cannot. It needs counterparties on the other side, which means it needs liquidity: clusters of orders, stop losses and pending positions it can trade against. Institutions therefore plan entries across multiple sessions, build positions gradually, and often push price toward areas where orders are crowded before taking the opposite side. Retail traders, with small size and instant execution, do not face this problem, which is why their behaviour on the chart looks so different.
Traditional technical indicators are calculations derived from past price, such as moving averages or oscillators. They can be useful, but they describe what has already happened rather than who is positioned. A buy signal can appear at a level where large sell orders are resting, simply because the indicator has no way of seeing those orders. SMC does not replace indicators with certainty either; nothing does. What it offers is a lens: it teaches you to mark liquidity pools, watch how price behaves around them, and read the structural changes that occur when large participants stop defending one side of the market. Used with discipline, that lens can add context that a naked indicator signal lacks.
Core SMC Concepts Every Beginner Must Know
The SMC framework is built from a handful of recurring ideas. The four most important for a beginner are liquidity, market structure, order blocks and fair value gaps. Each describes something observable on a normal candlestick chart, and each is most useful when combined with the others rather than traded in isolation.
Liquidity Sweeps & Retail Traps
On any chart, resting orders tend to cluster in predictable places. Buy-side liquidity sits above obvious swing highs, where breakout entries and short sellers' stop losses accumulate. Sell-side liquidity sits below obvious swing lows for the same reason. Equal highs and equal lows are particularly visible to everyone watching the chart, which is exactly why they are significant: large participants need liquidity to fill size, and these are the shelves where it is stocked.
A liquidity sweep, sometimes called a stop hunt or a raid, occurs when price briefly trades through such a level, triggers those orders, and then reverses. From the institutional perspective, that burst of triggered orders is the liquidity needed to fill large positions. From the retail perspective, it is the trap: traders who bought the breakout, or sold the breakdown, watch price immediately move against them.
Recognising sweeps changes how you read breakouts. Rather than treating every push above a high as the start of a trend, SMC traders ask whether the move gathered liquidity before reversing, and whether the sweep itself leaves an imprint, such as a long wick or an aggressive displacement candle, that marks where institutions transacted.
Market Structure Shifts (MSS) & Change of Character (CHoCH)
Market structure is the sequence of swing highs and swing lows a chart prints. An uptrend is a series of higher highs and higher lows; a downtrend is the mirror image. Two terms describe changes in that sequence. A break of structure, or BOS, occurs when price closes beyond the previous swing point in the direction of the trend, which is read as continuation. A change of character, or CHoCH, occurs when price first breaks against the prevailing trend, for example the first close below the most recent higher low in an uptrend.
A CHoCH does not guarantee a reversal, but it is the earliest structural warning that the trend's internal order has failed. Traders pay most attention to a change of character that occurs with displacement, meaning strong-bodied candles that cover distance quickly, and that happens right after a liquidity sweep. The combination, sweep then displacement then structure break, is the classic SMC reversal sequence.
Weaker signals, such as a slow grind through a swing point on wicks alone, are often treated as noise. As everywhere in this framework, the higher timeframe context matters: a CHoCH against the daily trend carries less weight than one that aligns with it.
Order Blocks (OB): Locating Institutional Footprints
An order block is a name for the last opposite-direction candle, or small cluster of candles, before a strong impulsive move. In a bullish example, it is the final down candle before an aggressive rally that leaves its range. The idea behind the name is that the aggressive move may have been driven by large buying, and the candles before it represent the zone where that buying was transacted. If price later returns to that zone, the unfilled interest may defend it again, which is why order blocks are watched as potential entry areas.
Several practical points matter. First, not every down candle before a rally qualifies; the move that follows must be genuinely impulsive and must break structure, otherwise it is just noise. Second, order blocks that have already been revisited many times, called mitigated blocks, are generally watched less closely than fresh ones. Third, many traders refine the zone on a lower timeframe, marking only the wicks or a portion of the candle rather than the whole range.
An order block is a level of interest, not a signal by itself. It earns its place in a setup only when it aligns with liquidity and a structural shift.
Fair Value Gaps (FVG): Spotting Imbalances
A fair value gap, or FVG, sometimes called an imbalance, is a three-candle pattern in which price moves so quickly that it leaves a gap between the wick of the first candle and the wick of the third. In an upward example, the high of candle one sits below the low of candle three, and the middle candle's strong body spans the space between. The interpretation is that price skipped over a range without balanced two-way trading, and markets often revisit such ranges later to transact in the prices they skipped.
An FVG therefore becomes a zone to watch for a retest, and many ICT-style entries are placed when price pulls back into a gap that sits inside an order block or near a swept level. Two cautions are worth remembering. Not every gap fills, and not every fill produces a continuation; gaps are also filled routinely in ranging markets, which is why they are read in context rather than in isolation. And a gap on a one-minute chart is a different animal from a gap on a four-hour chart. Beginners are usually better served by tracking gaps on the timeframes they trade and ignoring the rest.
Step-by-Step ICT Entry Setup
Knowing the vocabulary is not the same as knowing what to do when the market opens. This section turns the concepts above into a repeatable sequence you can practise on a demo chart. It is a learning framework, not a recommendation to trade any particular market, and each trader is responsible for testing and adapting the rules to their own circumstances.
Multi-Timeframe Top-Down Analysis
SMC analysis starts high and works down. The weekly and daily charts provide the bias and the larger liquidity map: where are the obvious highs and lows that price has been building against, and which side of the range is the market currently clearing? Many traders describe the next target as the draw on liquidity, the pool of resting orders that price is most plausibly moving toward.
Once the higher-timeframe narrative is set, the four-hour or one-hour chart is used to locate the areas where a reversal or continuation could begin, such as an unmitigated order block or a fair value gap aligned with the bias. Only then does attention move to an execution timeframe, often the fifteen-minute or five-minute chart, where the actual trigger is waited for.
This layering is the heart of the ICT approach: the higher timeframe tells you what to look for, the middle timeframe tells you where to look, and the lower timeframe tells you when. Skipping straight to the five-minute chart without a higher-timeframe story is the most common way beginners use this framework poorly, because the lower timeframe produces far more signals than anyone can sensibly trade.
Defining Precise Entry, Stop-Loss, and Take-Profit Rules
The following checklist converts the concepts into concrete rules. Write your own version of it and keep it in your trading journal.
- Define the bias: mark the higher-timeframe trend and the nearest liquidity pools in both directions.
- Wait for the event: a sweep of a marked liquidity level, followed by displacement and a change of character on your execution timeframe.
- Locate the entry zone: the order block or fair value gap that produced the displacement.
- Plan the entry: place a limit order in the zone, or wait for a confirmation close, and decide which method you use before the trade, not during it.
- Place the stop-loss: beyond the extreme of the sweep or the order block, at the price that would prove the idea wrong.
- Define the target: the opposing liquidity pool or the next higher-timeframe level, and only take the trade if the distance justifies the risk.
- If the stop is hit, the idea is invalidated; re-entering without a fresh setup turns a plan into a habit of chasing.
A Real-World Walkthrough of a Complete Setup
Here is how the sequence can look in practice, described as an illustration rather than a recommendation. Suppose the daily chart of a currency pair has been trending upward and price is approaching an old weekly high. On the four-hour chart, instead of breaking cleanly, price stalls under that high and then pushes slightly above it in a thin, wick-heavy move, sweeping the buy-side liquidity resting above it.
The next candles are strong and red, displacing lower and closing below the most recent four-hour higher low: a change of character after a sweep. That displacement leaves a fair value gap and originates from a fresh bearish order block. On the fifteen-minute chart, you wait for the retracement into that gap. A short position, if taken, is placed with a stop above the origin of the sweep and a first target at the nearest pool of sell-side liquidity below.
Whether the trade succeeds depends on information no one has in advance. The value of the framework is that it told you where to look, when to act, and where the idea is wrong. Repeating that process across many demo trades, with notes, is how the framework is actually learned.
Risk Management & Trading Psychology
A structure without risk rules is a story, not a strategy. Two habits matter more than any pattern in this framework: managing the size of each loss and managing your own reactions.
Master the Risk-to-Reward Ratio (R:R)
Risk-to-reward ratio, often written R:R, expresses the distance between your entry and your stop compared with the distance between your entry and your target. If you risk one unit, such as one percent of your account, to make two, you are trading at 1:2. The arithmetic of this is worth internalising: at a 1:2 ratio, a method can be profitable while being wrong more often than it is right, because each win covers more than one loss. The reverse is also true, which is why tight, arbitrary targets with wide stops quietly damage accounts even when the trader feels successful.
Position sizing follows from the stop distance, not the other way around. Decide the percentage of the account you are willing to risk per trade, then let the stop level determine the position size, rather than choosing a size and squeezing the stop to fit. Within the SMC framework the stop has a natural anchor: the level that would invalidate the idea, such as beyond the swept extreme. Targets that sit at the opposing liquidity pool give the R:R calculation a concrete reference instead of wishful thinking. All of this belongs in a written trading plan that you review and adjust over time.
Avoiding Emotional Traps: FOMO and Over-Leveraging
Fear of missing out, or FOMO, is the urge to enter after a move is already underway because it looks like it will leave without you. In SMC terms, entering late often means buying directly into the liquidity that larger participants use to exit. The framework's answer is procedural: if the sweep has passed and the retest has happened without you, the setup is gone, and there will be others.
Over-leveraging, using size too large for the account, converts normal losing streaks into account-ending ones. A fixed small risk per trade, defined in advance, is what keeps a beginner in the market long enough to learn. Two further habits help. Journal every trade with the reason for entry, the planned invalidation and the outcome, so patterns in your own behaviour become visible. And treat missed setups as neutral events rather than losses; in a framework built around liquidity and structure, setups recur, and the trader who does not chase is the one still present to take the next one.
Bridge to Practice: My Simple Strategy Book
Reading about liquidity, order blocks and fair value gaps is the easy part. The difficult part is turning them into decisions under time pressure, on a live chart, with money at stake. That gap between theory and execution is where most self-education stalls.
My Simple Strategy Book was written for exactly that stage: it takes the complex charts used in SMC and ICT discussions and reduces them to clear, step-by-step rules, with checklists you can follow before, during and after each session. Instead of a library of concepts, it gives you a single sequence to practise until it becomes automatic, then a framework for adding nuance as your experience grows. It is included with a ZoneEdu membership, alongside the rest of the library.
Conclusion
Smart Money Concepts is not a shortcut and it is not a prediction machine. It is a structured way of watching where order flow is likely to be concentrated and how price behaves when it gets there. Learn the vocabulary, build the routine, protect the account, and let experience, not hope, refine your read of the chart.
- SMC reframes chart reading around liquidity, structure and institutional footprints rather than indicator signals.
- Sweeps, changes of character, order blocks and fair value gaps are the beginner's core vocabulary; each is stronger in combination than alone.
- A top-down process, higher timeframe for bias and lower timeframe for execution, turns concepts into a repeatable routine.
- Risk management and psychology decide outcomes more than any single pattern; fixed small risk and journalling are non-negotiable habits.
- Practice on demo, document your rules, and use structured resources such as My Simple Strategy Book to move from theory to execution.
Frequently asked questions
This content is for educational purposes only and is not financial advice.

